Use
OmniMapFree is easy to use. The instructions on this web page describe how to use FgraMap, a version of OmniMapFree designed to display the genome features of the fungal plant pathogen Fusarium graminearum. The same methods can be used in all versions of OmniMapFree.
Starting FgraMap
In Windows Explorer double-click FgraMap.exe to run it.
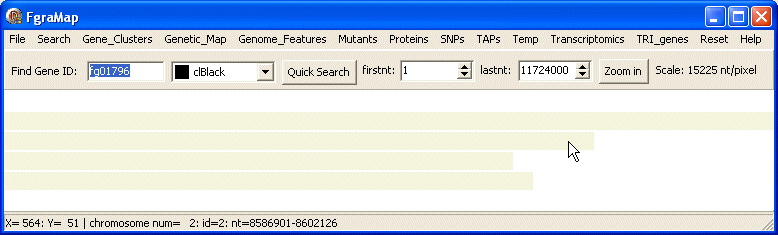
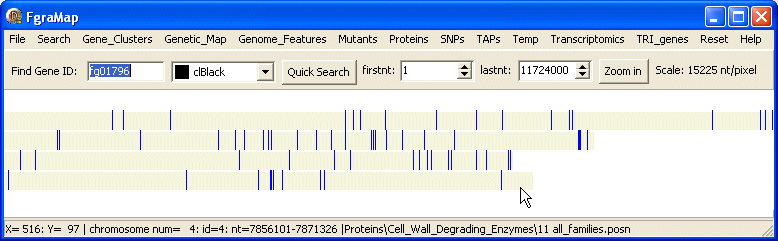
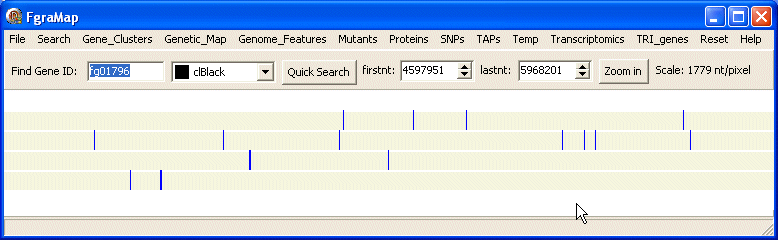
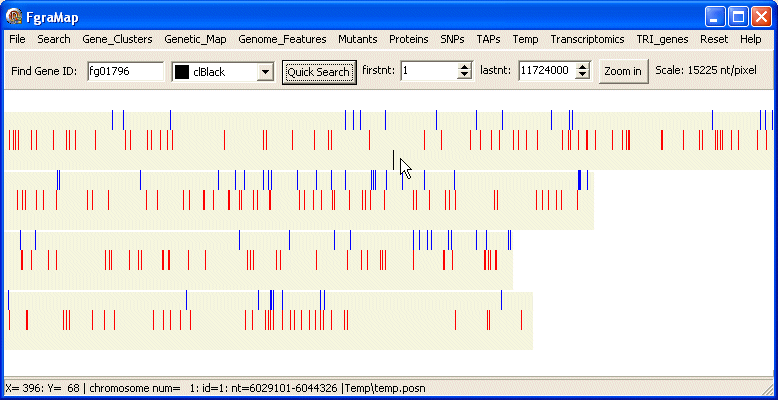
FgraMap opens as a new window taking up the entire screen. The title bar at the top of the window shows the name of the map - in this case Fgramap. Fusarium graminearum has four chromosomes, these are shown as gray horizontal bars scaled so that the longest chromosome is the width of the map window. Each chromosome is separated from the next by a thin white line. The firstnt and lastnt controls above the map window show the first and last nucleotide positions at the left and right sides of the map. To begin with these are set to the first and last nuceotide of the longest chromosome. If you use the mouse to move the cursor over a chromosome - the status bar at the bottom of the program shows the chromosome ID and nucleotide position you are pointing at.
Displaying Genes or Features
The menus at the top are used to select which genes or features are displayed.
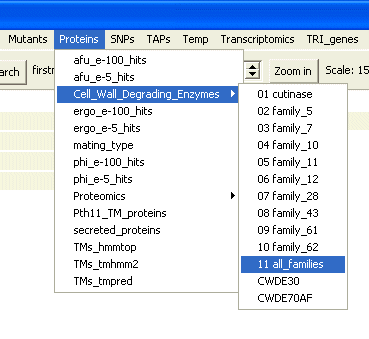
Selecting the menu items Cell_Wall_Degrading_Enzymes\11 all_familes displays these genes coloured blue on the chromosomes. The position and length of the blue blocks on the screen are proportional to the position and size of the genes on the chromosomes.
Selecting Chromosome Regions
Using the mouse you can select a region on the map covering one or more chromosomes by left-clicking and dragging across the image - the selected region is shown as a dashed rectangle. The status bar at the bottom of the program shows the region selected in nucleotide positions.
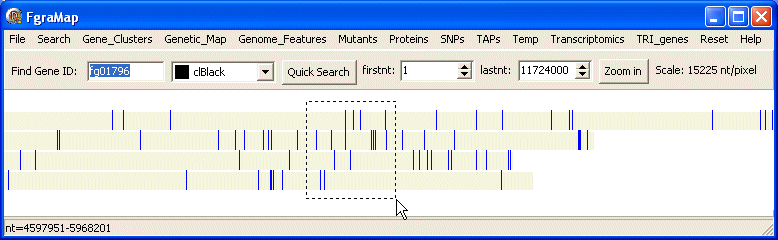
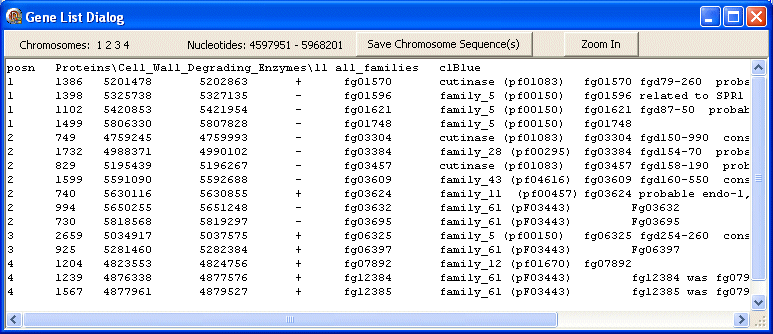
When you let go of the mouse button a Gene List Dialog box opens showing information about the genes/features displayed in the selected region. The top panel shows which chromosomes and nucleotides were selected. There are also buttons to save the sequence of the selected chromosome regions to file (useful if you want to further analyse this sub-sequence) and to zoom in on the map to the selected region.
The first line of the text gives the file type (posn), the menu item (Cell_Wall_Degrading_Enzymes\11 all_familes) and the colour used (blue).
This is followed by several lines, one for each gene, showing the chromosome ID, gene length, first nt, last nt, strand, gene ID and any anotation available for it.
Data Retrieval
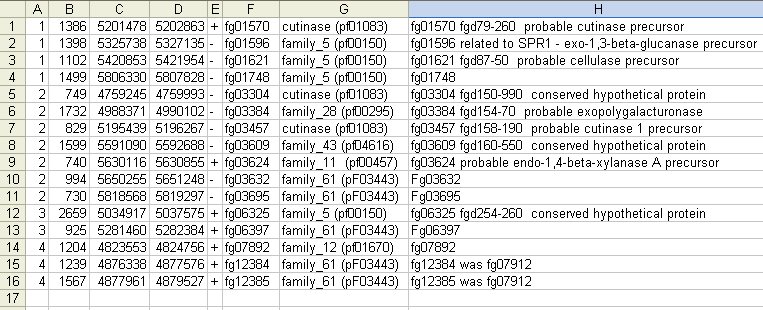
This text in the Gene List Dialog box can be copied and pasted into other programs e.g. an Excel spreadsheet. This works well because the text is tab-delimited. Once in a spreadsheet you can search and sort on any column.
Zoom
If you click the Zoom In button at the top-right the dialog box closes and the map zooms in to show the selected region expanded to fill the map window. The firstnt and lastnt spin edits in the top panel show the first and last nucleotides at the left and right edge of the new map window. The scale of the map is also shown in nucleotides/pixel.
You can zoom in further as much as you want to see the fine detail.
You can zoom out using the Reset menu using Undo Last Zoom or Zoom Fully Out.
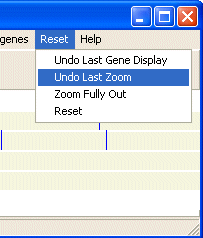
Also in the Reset menu you can remove the last gene/feature from the map using the Reset/Undo Last Gene Display menu. Or you can remove all genes/features from the map using the Reset/Reset menu.
Mixed Data
If you select another gene/feature for display it is shown as a new row in each chromosome below any earlier rows. Here you can see a new set of genes coloured red. This makes it easy to compare different genes or sets of genes with different properties. For example it makes it easy to see which genes are present in regions of chromosomes which have a high recombination frequency.
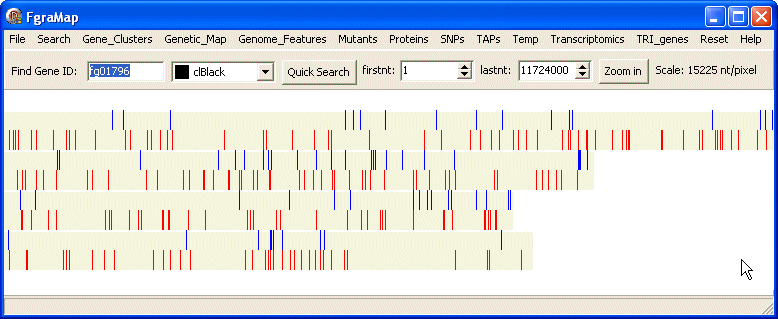
If the gene/feature is already displayed it is not displayed again but is moved to the bottom of the chromosomes.
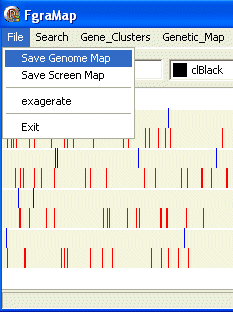
Saving Map Images
The File menu contains items for saving the whole genome or just that displayed on screen as bitmaps. These are saved as files genome_map.bmp and screen_map.bmp in the same top directory as FgraMap.exe.
Searching for single genes
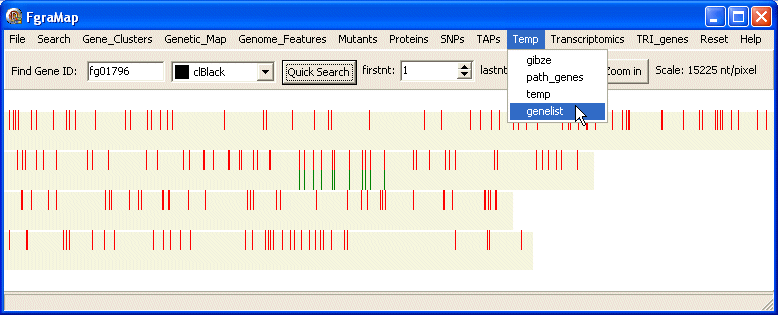
You can search for a single gene using Quick Search option on the top panel. Enter the gene id (e.g. fg01796) in the Find Gene ID edit box, select the colour you want it displayed in and click the Quick Search button. The gene will be displayed on a new row.
Searching for groups of genes
If you want to search for several genes use the Search/Search... menu item
This opens the "Display IDs in List" dialog box. Type or paste a list of gene IDs in the text box, select a colour to display, enter a name for the list and press the Search button.
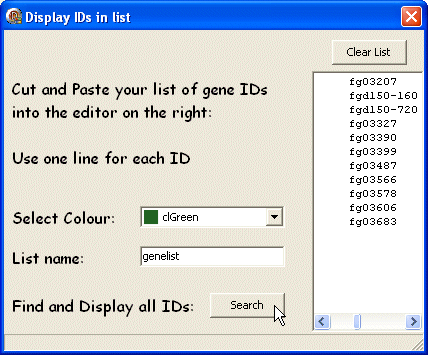
The genes will be displayed on the map. In the selected colour. Also the new gene list is added to the Temp menu using the name given by you - so you can display it again later, without repeating the search.
GeneList Dialog Box Contents
The contents of the GeneList depends on the type of data being displayed. This can be posn, freq, expr, graph or blast.
posn
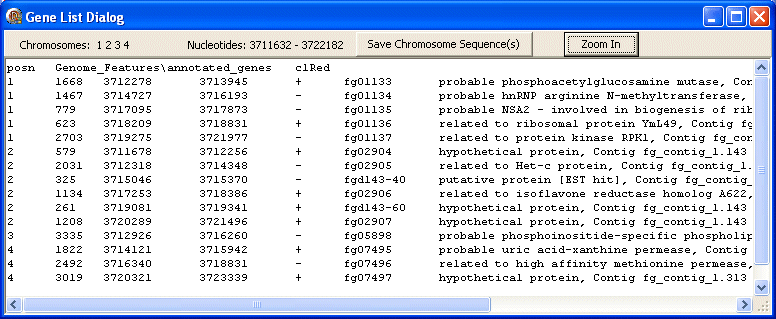
The first line contains the data type (posn) followed by the FgraMap path and filename of the data file (Genome_Features\annotated_genes) followed by the colour used to display these genes/features on the map (clRed).
The following lines show data about the selected genes/features including from left to right: chromosome id, length, first nt, last nt, strand, gene id, annotation.
freq
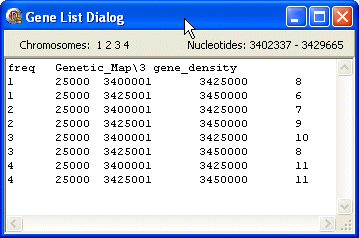
The first line contains the data type (freq) followed by the FgraMap path and filename of the data file (Genetic_Map\3 gene_density).
The following lines show data about the selected genes/features including from left to right: chromosome id, length, first nt, last nt. The last column contains a number (e.g. frequency count) used by FgraMap to select a colour from a colour gradient used to display this gene/feature.
expr
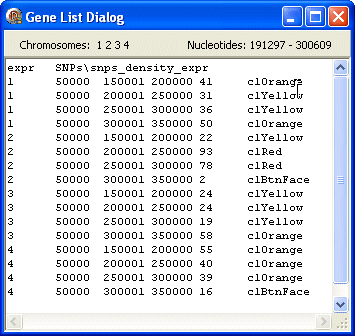
The first line contains the data type (expr) followed by the FgraMap path and filename of the data file (SNPs\snps_density_expr).
The following lines show data about the selected genes/features including from left to right: chromosome id, length, first nt, last nt, a number (e.g. relative expression) then a colour used to display this gene/feature.
The freq and expr data types are very similar and are used to display similar things but freq uses a colour gradient to determine the colour used whereas expr uses the colour value on the data line.
graph
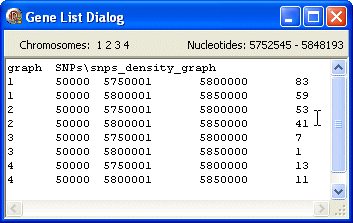
The first line contains the data type (graph) followed by the FgraMap path and filename of the data file (SNPs\snps_density_graph).
The following lines show data about the selected genes/features including from left to right: chromosome id, length, first nt, last nt, a number (e.g. density) whose value is used to display this gene/feature as a point/bar on a graph.
blast
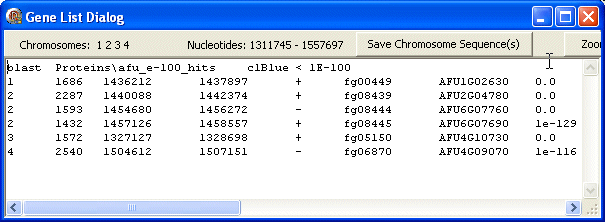
The first line contains the data type (blast) followed by the FgraMap path and filename of the data file (Proteins\afu_e-100_hits), the colour used to display (clBlue) and the e-value cut-off (1E-100).
The following lines show data about the selected genes/features including from left to right: chromosome id, length, first nt, last nt, strand, gene id, id of target gene hit in blast search and the e-value. Only hits with e-values less than the e-value cut-off (above) are displayed on the map in the colour indicated, and listed in the GeneList.